AI dashboard builder
The AI Builder lets you create dashboards by typing questions in a chat panel. The assistant turns each question into visual widgets backed by live platform data, so you can go from a question to a shareable dashboard without writing a single query.
Creating a dashboard
Click + New Dashboard in the Insights view. The editor opens with the AI chat panel on the right: type a question like "What did the payments team ship this week?" and the assistant generates a titled dashboard, with skeleton placeholders that fill in as each widget's data loads. If you're not sure where to start, the chat suggests starter queries you can pick from. When you like the result, click Save.
Here's the full flow, from the first question to a generated report:
Dashboards combine five kinds of widgets: KPI cards for the key numbers, bar and line charts for comparisons and trends, pie charts for distributions, and tables for detailed, sortable data.
Each widget runs its own data query. If one fails or times out, it shows an error with a retry option, and the rest of the dashboard is not affected.
Editing a dashboard
Every dashboard shares the same editing experience, whether you created it with the AI Builder or it came predefined with your organization. There are two ways to edit:
- Through the chat: ask a follow-up question to change the data, add widgets, or modify what the dashboard shows. This is the only way to change the underlying data queries.
- Manually: drag widgets to reorder them, or switch chart types (say, bar to line) directly in the editor.
The chat doesn't remember previous editing sessions. Each time you open a dashboard, the assistant only sees its current structure, so describe what you want changed based on what's on screen rather than referencing earlier conversations.
Saving and publishing
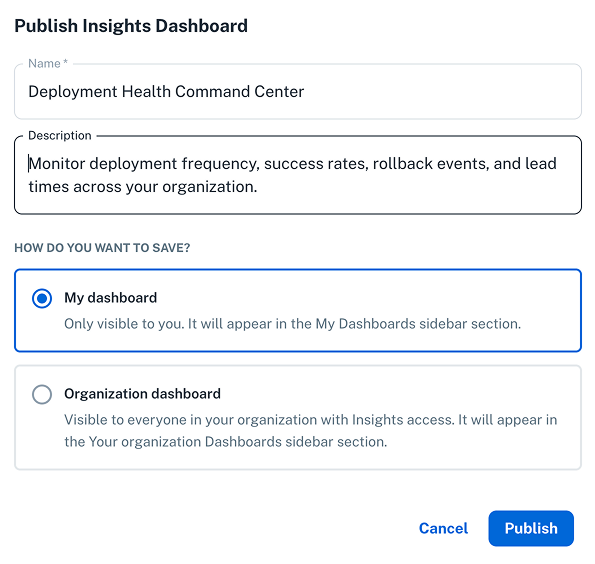
When you click Publish, a modal lets you choose how to save the dashboard.
Dashboard states
Dashboards have three possible states:
| State | Visible to | Description |
|---|---|---|
| Draft | Creator only | A new or unpublished dashboard. Appears in the dashboard list with a "Draft" badge. |
| Published | Organization or creator only | A published dashboard. Appears in the Insights sidebar for quick access. At publish time, you choose visibility: organization-wide or private. |
| Published with draft changes | Published version visible to viewers; draft changes visible to creator only | When you edit a published dashboard, changes are saved as a new draft version. Viewers keep seeing the last published version until you publish the update. |
Visibility
You choose visibility when publishing, and as the creator you can change it at any time by re-publishing:
- Organization: all members of your organization with the insights role can see the dashboard
- Only me: only you can see the dashboard
Dashboards you and your team publish appear in the Insights sidebar under your organization's name (e.g., ACME.INC DASHBOARDS), right next to the predefined ones, so the sidebar is a single place to access every dashboard.
Managing dashboards
From the dashboard list in the Insights view, you can search dashboards by name, filter by visibility, duplicate a dashboard to create a variation, or delete one you no longer need.
Predefined dashboards
Every nullplatform organization comes with predefined dashboards that give you instant visibility into your platform data. They work exactly like dashboards you create yourself: edit, customize, and republish them using the same flow.
| Section | Dashboard | What it shows |
|---|---|---|
| Applications | Apps & Scopes | Applications and scopes across your organization: counts, status, and distribution by namespace |
| Applications | Builds | Build activity, success rates, failure patterns, and trends over time |
| Services | Specs & Instances | Service specifications and their running instances, including health status and configuration |
| Delivery Metrics | DORA | The four DORA metrics: deployment frequency, lead time for changes, change failure rate, and time to restore service |
| Delivery Metrics | Deployments | Deployment history, outcomes by environment, and patterns across namespaces and applications |